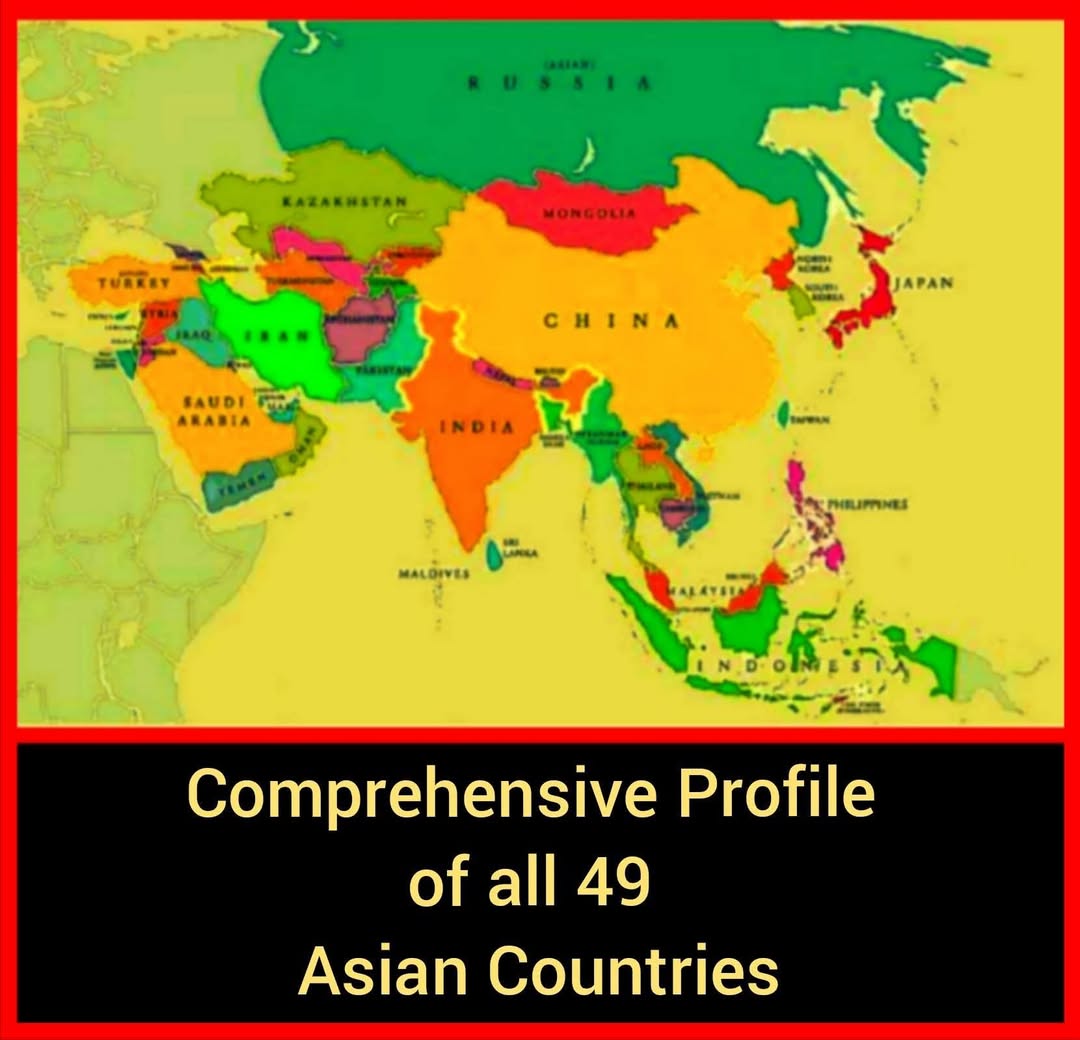
Comprehensive Profile of all 49 Asian Countries
Dr. Masood Tariq
Independent Political Theorist
Karachi, Pakistan
drmasoodtariq@gmail.com
Date: June 30, 2025
——————————————–
Abstract
This paper presents a comprehensive comparative profile of 49 Asian countries across key dimensions of national power: population, economy, purchasing power, per capita income, food security, military strength, and external military alignments.
Asia, the world’s largest and most populous continent, spans diverse geographies and civilisations—from energy-rich Gulf states to industrial East Asia and the rapidly expanding economies of South and Southeast Asia.
Using data from 2024–2025, this analysis offers a structured overview of Asia’s internal hierarchies and strategic orientations. It highlights the region’s developmental asymmetries, geopolitical fault lines, and evolving patterns of alignment with major global powers, including the United States, China, and Russia.
The summary tables provided aim to assist policymakers, researchers, analysts, and students in understanding the forces shaping Asia’s geopolitical future and its central role in defining the global order of the 21st century.
——————————————–
Introduction
Asia is not only the largest and most populous continent on Earth but also the most geopolitically significant. It comprises 49 sovereign countries across five interconnected subregions: South Asia, Central Asia, West Asia (commonly referred to as the Middle East), Southeast Asia, and East Asia. Collectively, these nations account for over 4.7 billion people—more than half of the world’s population—and include some of the most influential actors in global politics and economics.
The continent’s complexity lies in its striking contrasts. It includes industrialised economic powerhouses like Japan and South Korea; high-growth emerging markets such as India, Vietnam, and Indonesia; energy-exporting Gulf monarchies like Saudi Arabia and Qatar; and conflict-affected or fragile states such as Afghanistan, Syria, and Yemen. Asia also reflects a wide spectrum of political regimes, military doctrines, and historical alignments—many of which have roots in colonial legacies, Cold War rivalries, and ongoing great-power competition.
This study evaluates and compares the 49 Asian countries using the following seven strategic indicators:
(A) Population size (2024–2025 estimates)
(B) Economic power (Nominal GDP in USD)
(C) Per capita income (Nominal GDP per capita)
(D) Purchasing Power Parity (PPP-adjusted GDP)
(E) Food production and self-sufficiency
(F) Military strength (Global Firepower Index 2024)
(G) Military reliance or alignment (as of 2024–2025)
These indicators offer a multi-dimensional perspective on how power, prosperity, and strategic relevance are distributed across Asia. The paper further examines how these internal dynamics intersect with global realignments, particularly the competition between the United States, China, and Russia, and the growing bloc of non-aligned or strategically autonomous states.
By organising this data into clearly structured summary tables, this report provides a valuable reference for understanding Asia’s internal order and its implications for global strategy, economic competition, and regional stability.
——————————————–
(A). Summary Table: Population Rankings of 49 Asian Countries (2024–2025 Estimates)
1. India – ~1.44 billion — World Rank: 1st
2. China – ~1.43 billion — World Rank: 2nd
3. Indonesia – ~282 million — World Rank: 4th
4. Pakistan – ~248 million — World Rank: 5th
5. Bangladesh – ~172 million — World Rank: 8th
6. Japan – ~123 million — World Rank: 11th
7. Philippines – ~118 million — World Rank: 12th
8. Vietnam – ~100 million — World Rank: 15th
9. Turkey – ~87 million — World Rank: 17th
10. Iran – ~86 million — World Rank: 18th
11. Thailand – ~71 million — World Rank: 20th
12. Myanmar – ~56 million — World Rank: 26th
13. South Korea – ~52 million — World Rank: 27th
14. Iraq – ~44 million — World Rank: 38th
15. Afghanistan – ~42 million — World Rank: 36th
16. Saudi Arabia – ~37 million — World Rank: 40th
17. Uzbekistan – ~36 million — World Rank: 42nd
18. Russia (Asian part) – All of Asian Russia (including Siberia and Far East): Since ~75% of Russia’s 144 million people live in the European part, the remaining ~25% (≈36 million) reside in the Asian half — World Rank: 42nd
19. Malaysia – ~34 million — World Rank: 44th
20. Yemen – ~34 million — World Rank: 44th
21. Nepal – ~31 million — World Rank: 49th
22. North Korea – ~26 million — World Rank: 55th
23. Sri Lanka – ~22 million — World Rank: 59th
24. Kazakhstan – ~20 million — World Rank: 60th
25. Syria – ~20 million — World Rank: 61st
26. Cambodia – ~17 million — World Rank: 68th
27. Jordan – ~11 million — World Rank: 92nd
28. Tajikistan – ~10.5 million — World Rank: 92nd
29. Azerbaijan – ~10.3 million — World Rank: 94th
30. UAE – ~10.2 million — World Rank: 95th
31. Israel – ~10.2 million — World Rank: 97th
32. Laos – ~8.3 million — World Rank: 104th
33. Kyrgyzstan – ~7 million — World Rank: 108th
34. Lebanon – ~6.8 million — World Rank: 109th
35. Turkmenistan – ~6.5 million — World Rank: 112th
36. Singapore – ~5.9 million — World Rank: 117th
37. Oman – ~5.49 million — World Rank: 120th
38. Palestine – ~5.2 million — World Rank: 122nd
39. Kuwait – ~4.26 million — World Rank: 131st
40. Georgia – ~3.7 million — World Rank: 134th
41. Mongolia – ~3.4 million — World Rank: 135th
42. Qatar – ~2.9 million — World Rank: 138th
43. Armenia – ~2.9 million — World Rank: 138th
44. Bahrain – ~1.52 million — World Rank: 152nd
45. Timor-Leste – ~1.4 million — World Rank: 154th
46. Cyprus – ~1.25 million — World Rank: 158th
47. Bhutan – ~800,000 — World Rank: 162nd
48. Maldives – ~560,000 — World Rank: 171st
49. Brunei – ~470,000 — World Rank: 172nd
——————————————–
(B). Summary Table: Economic Size Rankings of 49 Asian Countries (Nominal GDP in USD, 2024–2025)
1. China – ~$19.2 trillion — World Rank: 2nd
2. Japan – ~$4.2 trillion — World Rank: 4th
3. India – ~$3.7 trillion — World Rank: 5th
4. South Korea – ~$1.7 trillion — World Rank: 14th
5. Indonesia – ~$1.37 trillion — World Rank: 17th
6. Turkey – ~$1.12 trillion — World Rank: 19th
7. Saudi Arabia – ~$1.07 trillion — World Rank: 20th
8. Thailand – ~$515 billion — World Rank: 29th
9. Israel – ~$514 billion — World Rank: 30th
10. UAE – ~$514 billion — World Rank: 30th
11. Singapore – ~$501 billion — World Rank: 32nd
12. Philippines – ~$437 billion — World Rank: 36th
13. Bangladesh – ~$437 billion — World Rank: 36th
14. Vietnam – ~$430 billion — World Rank: 37th
15. Iran – ~$405 billion — World Rank: 39th
16. Malaysia – ~$400 billion — World Rank: 38th
17. Egypt – ~$396 billion — World Rank: 40th
18. Pakistan – ~$338 billion — World Rank: 45th
19. Kazakhstan – ~$263 billion — World Rank: 50th
20. Iraq – ~$251 billion — World Rank: 52nd
21. Qatar – ~$213 billion — World Rank: 55th
22. Kuwait – ~$164 billion — World Rank: 58th
23. Oman – ~$109 billion — World Rank: 64th
24. Uzbekistan – ~$102 billion — World Rank: 68th
25. Sri Lanka – ~$87 billion — World Rank: 73rd
26. Syria – ~$77 billion — World Rank: 76th
27. Azerbaijan – ~$68 billion — World Rank: 79th
28. Turkmenistan – ~$65 billion — World Rank: 81st
29. Myanmar – ~$65 billion — World Rank: 81st
30. Jordan – ~$50 billion — World Rank: 88th
31. Nepal – ~$45 billion — World Rank: 90th
32. Bahrain – ~$44 billion — World Rank: 91st
33. Cyprus – ~$30 billion — World Rank: 94th
34. Cambodia – ~$30 billion — World Rank: 94th
35. Georgia – ~$29 billion — World Rank: 97th
36. Yemen – ~$28 billion — World Rank: 98th
37. Lebanon – ~$22 billion — World Rank: 105th
38. Armenia – ~$21 billion — World Rank: 106th
39. Palestine – ~$20 billion — World Rank: 108th
40. Mongolia – ~$17 billion — World Rank: 114th
41. Laos – ~$16 billion — World Rank: 115th
42. Afghanistan – ~$15 billion — World Rank: 116th
43. Brunei – ~$14 billion — World Rank: 118th
44. Kyrgyzstan – ~$11 billion — World Rank: 120th
45. Tajikistan – ~$10 billion — World Rank: 124th
46. Maldives – ~$6 billion — World Rank: 145th
47. Timor-Leste – ~$3.2 billion — World Rank: 160th
48. Bhutan – ~$3 billion — World Rank: 161st
49. North Korea – Data unavailable
——————————————–
(C). Summary Table: Rankings by Per Capita GDP of 49 Asian Countries (Nominal GDP in USD, 2024–2025)
1. Singapore – $93,956 — World Rank: 4th
2. Macao SAR – $84,276 — World Rank: ~8th
3. Qatar – $72,760 — World Rank: 9th
4. Hong Kong SAR – $55,608 — World Rank: ~20th
5. Israel – $54,370 — World Rank: ~21st
6. United Arab Emirates – $51,294 — World Rank: ~18th–22nd
7. Cyprus – $40,552 — World Rank: ~30th
8. South Korea – $37,675 — World Rank: ~32nd
9. Brunei – $37,023 — World Rank: ~35th
10. Japan – $35,611 — World Rank: ~37th
11. Taiwan – $34,426 — World Rank: ~38th
12. Saudi Arabia – $33,287 — World Rank: ~39th
13. Kuwait – $31,682 — World Rank: ~42nd
14. Bahrain – $29,886 — World Rank: ~46th
15. Oman – $20,230 — World Rank: ~60th
16. Maldives – $18,599 — World Rank: ~64th
17. Malaysia – $14,423 — World Rank: ~71st
18. China – $13,873 — World Rank: ~73rd
19. Turkmenistan – $13,338 — World Rank: ~85th
20. Georgia – $9,613 — World Rank: ~86th
21. Armenia – $8,965 — World Rank: ~89th
22. Thailand – $7,754 — World Rank: ~100th
23. Mongolia – $7,576 — World Rank: ~101st
24. Azerbaijan – $7,428 — World Rank: ~103rd
25. Iraq – $5,951 — World Rank: ~112th
26. Iran – $5,300 — World Rank: ~120th
27. Indonesia – $5,248 — World Rank: ~121st
28. Vietnam – $4,981 — World Rank: ~122nd
29. Jordan – $4,904 — World Rank: ~123rd
30. Bhutan – $4,495 — World Rank: ~126th
31. Philippines – $4,439 — World Rank: ~128th
32. Sri Lanka – $4,168 — World Rank: ~131st
33. Lebanon – $3,879 — World Rank: ~135th
34. Palestine – $3,480 — World Rank: ~136th
35. Uzbekistan – $3,468 — World Rank: 137th
36. Cambodia – $2,948 — World Rank: ~140th
37. Bangladesh – $2,773 — World Rank: ~145th
38. Kyrgyzstan – $2,405 — World Rank: ~150th
39. Laos – $1,854 — World Rank: ~158th
40. Timor-Leste – ~$1,700 — World Rank: ~159th
41. Pakistan – $1,655 — World Rank: ~161st
42. Nepal – $1,486 — World Rank: ~165th
43. Tajikistan – $1,276 — World Rank: 163rd
44. North Korea (DPRK) – $1,217 — World Rank: 170th
45. Myanmar – $1,187 — World Rank: ~178th
46. Yemen – $628 — World Rank: 187th
47. Afghanistan – $392 — World Rank: ~192nd
——————————————–
(D). Summary Table: Rankings of PPP (Purchasing Power Parity) of 49 Asian Countries (PPP-adjusted, in international dollars, IMF 2024–2025)
1. Singapore – $156,755 — World Rank: 1st
2. Macao SAR – $134,042 — World Rank: 3rd
3. Qatar – $121,605 — World Rank: 4th
4. Brunei – $95,758 — World Rank: 7th
5. Taiwan – $84,082 — World Rank: 11th
6. United Arab Emirates – $81,676 — World Rank: 13th
7. Hong Kong SAR – $77,942 — World Rank: 14th
8. Bahrain – $67,794 — World Rank: 24th
9. South Korea – $65,112 — World Rank: 25th
10. Cyprus – $65,088 — World Rank: 25th
11. Saudi Arabia – $61,922 — World Rank: 26th
12. Israel – $57,760 — World Rank: 27th
13. Kuwait – $55,981 — World Rank: 28th
14. Japan – $46,231 — World Rank: 51st
15. Maldives – $36,585 — World Rank: ~63rd
16. Oman – $35,638 — World Rank: 66th
17. Kazakhstan – $35,497 — World Rank: 69th
18. Turkey – $34,685 — World Rank: 70th
19. Malaysia – $34,205 — World Rank: 74th
20. Georgia – $23,484 — World Rank: 93rd
21. China – $22,100 — World Rank: 97th
22. Azerbaijan – $21,570 — World Rank: 99th
23. Thailand – $21,100 — World Rank: 101st
24. Armenia – $19,200 — World Rank: 108th
25. Mongolia – $16,200 — World Rank: 115th
26. Iran – $15,900 — World Rank: 116th
27. Indonesia – $14,501 — World Rank: 127th
28. Vietnam – $14,285 — World Rank: 131st
29. Sri Lanka – $12,519 — World Rank: 132nd
30. India – $12,131 — World Rank: ~134th
31. Lebanon – $11,277 — World Rank: 140th
32. Philippines – $10,446 — World Rank: 148th
33. Bhutan – $10,000 — World Rank: ~149th (approximate)
34. Jordan – $9,471 — World Rank: 150th
35. Uzbekistan – $9,300 — World Rank: 151st
36. Bangladesh – $8,646 — World Rank: ~154th
37. Laos – $8,601 — World Rank: 155th
38. Pakistan – $6,950 — World Rank: ~160th
39. Kyrgyzstan – $6,479 — World Rank: 165th
40. Myanmar – $5,476 — World Rank: 176th
41. Palestine – $5,300 — World Rank: ~177th (estimate)
42. Cambodia – $5,132 — World Rank: 178th
43. Nepal – $4,979 — World Rank: 179th
44. Tajikistan – $4,714 — World Rank: 181st
45. Timor-Leste – $4,300 — World Rank: 184th
46. Syria – $4,000 — World Rank: ~185th (estimate)
47. Yemen – $1,996 — World Rank: 190th
48. Afghanistan – $1,807 — World Rank: 196th
49. North Korea (DPRK) – $1,700 — World Rank: ~197th (estimate)
——————————————–
(E). Summary Table: Food production in 49 Asian Countries (Including self-sufficiency ratios)
1. Cambodia •
Rice 104%, Wheat 103%, Maize 107%, Veg ~95%, Meat ~80%, Dairy ~30% •
Rank 1–5 | Strong staple exporter; moderate meat/dairy.
2. Kazakhstan •
Wheat ≥100%, Rice n/a, Maize n/a, Veg ~80%, Meat ~90%, Dairy ~70% •
Rank 2–6 | Major grain producer; strong meat/dairy.
3. Thailand •
Rice 123%, Wheat 101%, Maize 189%, Veg ~90%, Meat ~85%, Dairy ~40% •
Rank 3–7 | Leading rice exporter; moderate dairy.
4. Myanmar •
Rice 107%, Wheat 133%, Maize 111%, Veg ~85%, Meat ~60%, Dairy ~20% •
Rank 4–8 | High staple SSR; lower livestock.
5. Laos •
Rice 104%, Wheat 124%, Maize 99%, Veg ~80%, Meat ~70%, Dairy ~15% •
Rank 5–9 | Staple-sufficient; limited dairy.
6. China •
Rice ~98%, Wheat ~99%, Maize ~99%, Veg ~90%, Meat ~75%, Dairy ~60% •
Rank 6–10 | Strong staples; growing livestock.
7. Vietnam •
Rice 86%, Maize 123%, Veg ~85%, Meat ~70%, Dairy ~10% •
Rank 7–12 | Rice + maize strong; low dairy.
8. India •
Rice ~100%, Wheat ~100%, Veg ~75%, Meat ~40%, Dairy ~60% •
Rank 8–15 | Robust staples; mixed livestock.
9. Pakistan •
Rice ~100%, Wheat ~100%, Veg ~70%, Meat ~50%, Dairy ~35% •
Rank 9–16 | Strong grains; moderate dairy.
10. Sri Lanka •
Rice ~95%, Veg ~60%, Meat ~40%, Dairy ~20% •
Rank 10–20 | Rice-reliant; low livestock.
11. Uzbekistan •
Wheat ~100%, Veg ~75%, Meat ~60%, Dairy ~50% •
Rank 11–20 | Staple grain; moderate livestock.
12. Turkey •
All staples ~95%, Veg ~85%, Meat ~70%, Dairy ~50% •
Rank 11–20 | Balanced agriculture and livestock.
13. Armenia •
All staples ≥80%, Veg ~70%, Meat ~60%, Dairy ~40% •
Rank 15–25 — Stable staple producers; limited dairying.
14. Azerbaijan •
All staples ≥80%, Veg ~70%, Meat ~60%, Dairy ~40% •
Rank 15–25 — Stable staple producers; limited dairying.
15. Georgia •
All staples ≥80%, Veg ~70%, Meat ~60%, Dairy ~40% •
Rank 15–25 — Stable staple producers; limited dairying.
16. Kyrgyzstan •
All staples ≥80%, Veg ~70%, Meat ~60%, Dairy ~40% •
Rank 15–25 — Stable staple producers; limited dairying.
17. Turkmenistan •
Wheat ~100%, Rice ~80%, Maize ~70%, Vegetables ~75%, Meat ~65%, Dairy ~50%
Rank 15–25 — Stable staple producers; limited dairying.
18. Tajikistan •
All staples ≥80%, Veg ~70%, Meat ~60%, Dairy ~40% •
Rank 15–25 — Stable staple producers; limited dairying.
19. Mongolia •
Veg ~70%, Meat ~90%, Dairy ~80%, Cereals low (~50%) •
Rank 20–30 | Livestock-based; low grains.
20. Nepal •
Rice <100%, Veg ~70%, Meat ~30%, Dairy ~20% •
Rank 20–30 | Gaps in livestock; grain imports.
21. Japan •
Rice SSR ~98–99%; Veg ~85%, Meat ~30–40%, Dairy ~25–30% •
Rank 20–30 — Staples high; heavy import reliance on livestock.
22. South Korea •
Rice SSR ~98–99%; Veg ~85%, Meat ~30–40%, Dairy ~25–30% •
Rank 20–30 — Staples high; heavy import reliance on livestock.
23. Indonesia •
Rice SSR ~98–99%; Veg ~85%, Meat ~30–40%, Dairy ~25–30% •
Rank 20–30 — Staples high; heavy import reliance on livestock.
24. Bhutan •
Rice ~31–90%, Veg ~60–80%, Meat ~35–50%, Dairy ~20–30% •
Rank 30–40 — Mixed; moderate livestock.
25. Bangladesh •
Rice ~31–90%, Veg ~60–80%, Meat ~35–50%, Dairy ~20–30% •
Rank 30–40 — Mixed; moderate livestock.
26. Malaysia •
Rice ~31–90%, Veg ~60–80%, Meat ~35–50%, Dairy ~20–30% •
Rank 30–40 — Mixed; moderate livestock.
27. Brunei •
Rice SSR 8%, Meat ~30%, Veg ~20%, Dairy ~10% •
Rank 40–50 | Highly import‑dependent, especially staple grains.
28. Cyprus •
All staples <50%, Veg ~20–50%, Meat ~40–60%, Dairy ~30–60% •
Rank 40–60 — Limited agriculture; heavy imports even for livestock.
29. Israel •
All staples <50%, Veg ~20–50%, Meat ~40–60%, Dairy ~30–60% •
Rank 40–60 — Limited agriculture; heavy imports even for livestock.
30. Oman •
All staples <50%, Veg ~20–50%, Meat ~40–60%, Dairy ~30–60% •
Rank 40–60 — Limited agriculture; heavy imports even for livestock.
31. Qatar •
All staples <50%, Veg ~20–50%, Meat ~40–60%, Dairy ~30–60% •
Rank 40–60 — Limited agriculture; heavy imports even for livestock.
32. Kuwait •
All staples <50%, Veg ~20–50%, Meat ~40–60%, Dairy ~30–60% •
Rank 40–60 — Limited agriculture; heavy imports even for livestock.
33. Bahrain •
All staples <50%, Veg ~20–50%, Meat ~40–60%, Dairy ~30–60% •
Rank 40–60 — Limited agriculture; heavy imports even for livestock.
34. Saudi Arabia •
All staples <50%, Veg ~20–50%, Meat ~40–60%, Dairy ~30–60% •
Rank 40–60 — Limited agriculture; heavy imports even for livestock.
35. UAE •
All staples <50%, Veg ~20–50%, Meat ~40–60%, Dairy ~30–60% •
Rank 40–60 — Limited agriculture; heavy imports even for livestock.
36. Egypt •
All staples <50%, Veg ~20–50%, Meat ~40–60%, Dairy ~30–60% •
Rank 40–60 — Limited agriculture; heavy imports even for livestock.
37. Iraq •
Staple SSR ~60%, Livestock ~40–50% •
Rank 40–60 | Moderate cereal, limited meat/dairy.
38. Jordan •
All SSR <30%; staples ~10–20%, livestock ~20–30% •
Rank 40–60 | High import dependence.
39. Lebanon •
SSR ~30–50%; agriculture fragmented •
Rank 50–60 | High import dependence.
40. Maldives •
SSR near 0% across staples + livestock •
Rank 50–60 | Almost fully import‑dependent.
41. Timor‑Leste •
SSR <50% in cereals; Veg ~30%, Meat ~20%, Dairy ~10% •
Rank 50–70 | High dependence.
42. Afghanistan •
All SSR <50% across all categories •
Rank 60–80 | Conflict‑driven food insecurity; imports essential.
43. Syria •
All SSR <50% across all categories •
Rank 60–80 | Conflict‑driven food insecurity; imports essential.
44. Yemen •
All SSR <50% across all categories •
Rank 60–80 | Conflict‑driven food insecurity; imports essential.
45. Palestine •
Staple ~50–70%, Veg ~60%, Meat ~40%, Dairy ~30% •
Rank 60–80 | Agriculture possible, but disrupted.
46. North Korea •
Rice/wheat SSR ~83–99%, Meat ~50%, Dairy ~30% •
Rank 60–80 | Cereal strong; imports for proteins/dairy.
47. Macao SAR •
Minimal agriculture; SSR <10% across all categories •
Rank >100 | Almost entirely import‑dependent.
48. Hong Kong SAR •
SSR <5% across categories •
Rank >100 | Fully import‑dependent.
49. Singapore •
SSR <10% across all categories •
Rank >100 | Nearly all food imported.
Notes:
“n/a” indicates staple not typically produced.
Vegetable SSR figures are general estimates: major producers (China, Southeast Asia) have ~85–95%, minor producers/urban states have <50%.
Meat (livestock, poultry) SSR ranges from 30–90% depending on local industry.
Dairy SSR (milk, cheese, etc.) often lags behind other food groups, maxing at ~60–80% in leading agricultural nations.
Global SSR Rank shows relative standing among ~190 countries: 1–20 indicates highest self-reliance; >100 indicates extreme import-dependency.
——————————————–
(F). Summary Table: Military Power Rankings in 49 Asian Countries (Global Firepower Index 2024)
1. China – World Rank: 3rd
2. India – World Rank: 4th
3. South Korea – World Rank: 6th
4. Pakistan – World Rank: 7th
5. Turkey – World Rank: 8th
6. Japan – World Rank: 10th
7. Indonesia – World Rank: 13th
8. Iran – World Rank: 14th
9. Egypt – World Rank: 15th
10. Israel – World Rank: 17th
11. Vietnam – World Rank: 20th
12. Saudi Arabia – World Rank: 22nd
13. Thailand – World Rank: 25th
14. Philippines – World Rank: 32nd
15. Singapore – World Rank: 34th
16. Myanmar – World Rank: 39th
17. Bangladesh – World Rank: 42nd
18. Malaysia – World Rank: 44th
19. Iraq – World Rank: 45th
20. UAE – World Rank: 54th
21. Azerbaijan – World Rank: 58th
22. Uzbekistan – World Rank: 62nd
23. Syria – World Rank: 64th
24. Kazakhstan – World Rank: 64th
25. Sri Lanka – World Rank: 71st
26. Yemen – World Rank: 74th
27. Oman – World Rank: 76th
28. Qatar – World Rank: 77th
29. Kuwait – World Rank: 78th
30. Turkmenistan – World Rank: 82nd
31. Jordan – World Rank: 89th
32. Nepal – World Rank: 94th
33. Tajikistan – World Rank: 99th
34. Kyrgyzstan – World Rank: 107th
35. Georgia – World Rank: 108th
36. Mongolia – World Rank: 109th
37. Cyprus – World Rank: 110th
38. Armenia – World Rank: 111th
39. Lebanon – World Rank: 118th
40. Bahrain – World Rank: 119th
41. Cambodia – World Rank: 122nd
42. Laos – World Rank: 126th
43. Bhutan – World Rank: 141st
44. Brunei – World Rank: 148th
45. Timor-Leste – World Rank: 150th
46. Maldives – World Rank: 151st
47. North Korea – Unranked (nuclear-capable; opaque)
48. Afghanistan – Not ranked (Taliban rule)
49. Palestine – Not ranked
——————————————–
(G). Summary Table: Military Reliance or Alignment of all 49 Asian countries (as of 2024–2025)
1. Aligned with the United States (U.S.):
Japan, South Korea, Philippines, Thailand, Singapore, Israel, Jordan, Kuwait, Bahrain, Qatar, UAE, Saudi Arabia, Iraq
2. Aligned with China:
Pakistan, North Korea, Cambodia, Laos, Myanmar (partial), Iran (strategic), Afghanistan (limited cooperation under Taliban)
3. Aligned with Russia:
India (historically reliant but diversifying), Vietnam (historic), Kazakhstan, Uzbekistan, Armenia, Kyrgyzstan, Tajikistan, Turkmenistan, Syria
4. Independent / Mixed / Non-Aligned:
Indonesia, Malaysia, Bangladesh, Turkey, Sri Lanka, Nepal, Lebanon, Mongolia, Azerbaijan, Georgia, Palestine, Oman, Bhutan, Maldives, Brunei, Timor-Leste, Cyprus
Summary Insight:
U.S.-aligned countries dominate the Middle East and key East/Southeast Asian maritime states.
China-aligned states are generally U.S. adversaries or strategic dependents.
Russia-aligned states are primarily Central Asian or hold Cold War ties.
A growing number of Asian states remain independent or strategically non-aligned, seeking autonomy in global blocs.
——————————————–
Summary
Asia’s strategic landscape is marked by vast internal diversity and uneven development across its 49 sovereign states. This comprehensive profile demonstrates that while countries like China, India, Japan, and South Korea dominate in terms of population, economic output, and military strength, smaller states such as Singapore, Qatar, and the UAE assert outsized influence through financial power, strategic geography, and international alignments.
The data reveal three major continental patterns:
1. Demographic Giants vs. High-Income States:
While India and China lead in population, several smaller states—including Singapore, Qatar, and Brunei—rank among the highest globally in per capita GDP and PPP-adjusted income. This reflects divergent development models across the continent.
2. Military Stratification and Alignments:
Asia hosts some of the world’s most powerful armed forces (China, India, South Korea, Pakistan, Turkey), alongside dozens of mid- and lower-tier militaries. Military alignment also reveals geopolitical blocs: U.S.-aligned states dominate the Middle East and maritime East Asia, while China and Russia retain influence in South and Central Asia.
3. Food Security and Agricultural Self-Reliance:
Southeast Asia and parts of Central Asia demonstrate high food self-sufficiency, while Gulf states and East Asian city-states remain heavily dependent on imports. Food security remains a critical differentiator in Asia’s internal resilience, particularly under climate and conflict stress.
The continent’s strategic direction is increasingly defined by the competition and cooperation among its leading powers, the realignment of military partnerships, and the quest for economic sovereignty. This paper’s comparative tables offer a data-driven foundation for interpreting these shifts and anticipating future geopolitical trends.
As Asia becomes the epicentre of global power competition, its internal balance—between demographic weight, economic performance, food sovereignty, and military alignment—will decisively shape the emerging world order.
——————————————–
Conclusion
Asia’s geopolitical architecture is undergoing a profound transformation shaped by demographic weight, economic divergence, shifting military alliances, and strategic realignments. This comprehensive survey of 49 Asian countries illustrates how the continent—while geographically unified—is internally fragmented by contrasting development trajectories, military capacities, food security levels, and external alignments.
The rise of China and India as demographic and economic superpowers is paralleled by the strategic leverage of smaller, high-income states like Singapore, Qatar, and the UAE. Central Asian republics maintain historical ties with Russia, while maritime nations and Gulf monarchies increasingly align with the United States. Meanwhile, a growing bloc of states—such as Indonesia, Turkey, Malaysia, and Bangladesh—pursue mixed or non-aligned foreign policies, seeking greater autonomy in a multipolar world.
Food production and self-sufficiency further divide Asia’s nations, underscoring vulnerabilities in import-dependent states, particularly in the Gulf and East Asian city-states. In contrast, agrarian economies in South and Southeast Asia continue to anchor regional stability through domestic food resilience.
Collectively, these trends indicate that Asia is not a monolithic bloc but a dynamic and contested geopolitical arena. Its future will be determined by the balance between economic modernisation, demographic management, food security, and strategic independence. As the global centre of gravity shifts eastward, Asia’s internal hierarchies will play a decisive role in shaping the 21st-century global order.
This paper provides not only comparative rankings and statistics but also a strategic framework to interpret the evolving power structures within Asia. Policymakers, scholars, and analysts must engage with this complexity to craft responsive and forward-looking regional strategies.
——————————————–
Author Biography
Dr. Masood Tariq is a Karachi-based politician and political theorist. He formerly served as Senior Vice President of the Pakistan Muslim Students Federation (PMSF) Sindh, Councillor of the Municipal Corporation Hyderabad, Advisor to the Chief Minister of Sindh, and Member of the Sindh Cabinet.
His research explores South Asian geopolitics, postcolonial state formation, regional nationalism, and inter-ethnic politics, with a focus on the Punjabi question and Cold War strategic alignments.
He also writes on Pakistan’s socio-political and economic structures, analysing their structural causes and proposing policy-oriented solutions aligned with historical research and contemporary strategy.
His work aims to bridge historical scholarship and strategic analysis to inform policymaking across South Asia, Central Asia, and the Middle East.


Leave a Reply