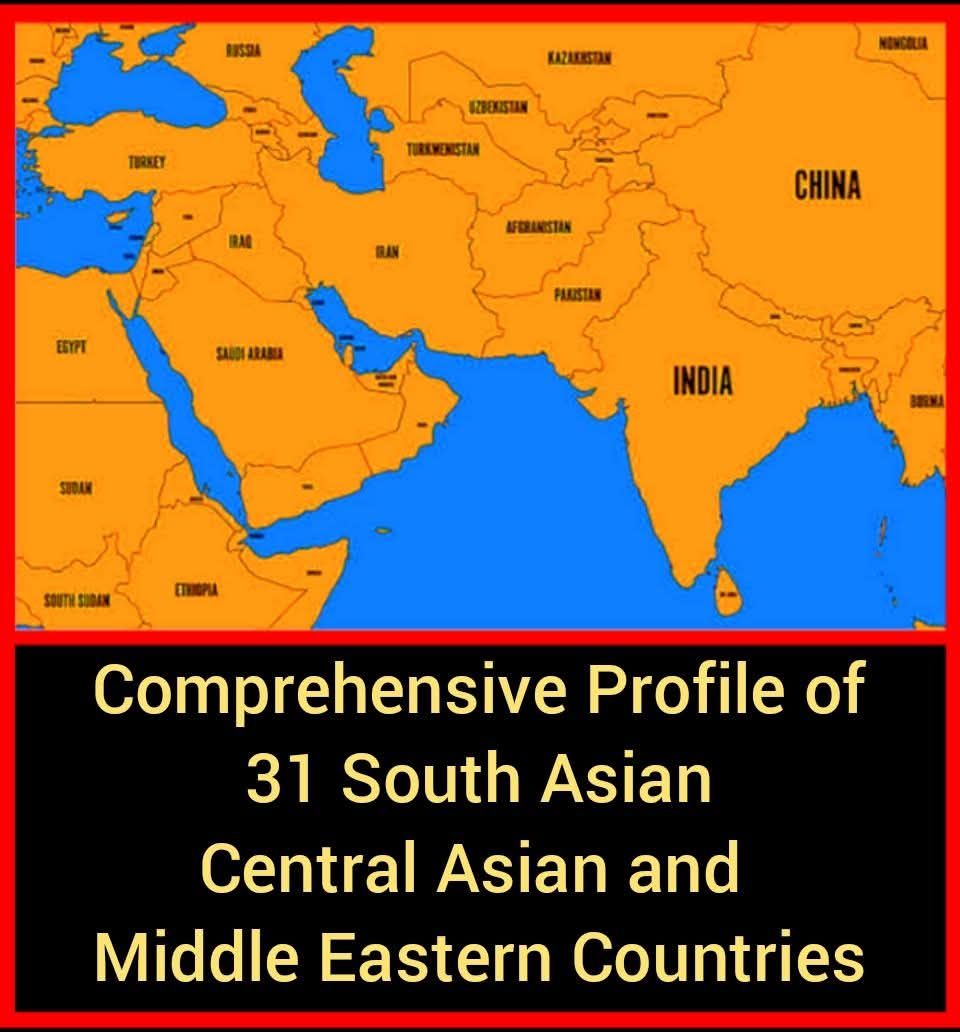
Comprehensive Profile of 31 South Asian, Central Asian, and Middle Eastern Countries
Dr. Masood Tariq
Independent Political Theorist
Karachi, Pakistan
drmasoodtariq@gmail.com
Date: June 26, 2025
——————————————–
Introduction
The South Asian, Central Asian, and Middle Eastern regions constitute some of the most geopolitically consequential areas in the world today. Home to over 2 billion people, these interconnected regions are defined by deep civilizational roots, diverse ethnic and linguistic identities, energy resources, and a complex history of colonialism, conflict, and cooperation.
In the 21st century, these countries are increasingly at the forefront of global demographic shifts, economic transformations, and security realignments.
This comprehensive profile presents a comparative snapshot of 31 countries across these three regions using three key indicators: total population, nominal Gross Domestic Product (GDP), and conventional military power, with data drawn from the latest available estimates (2024–2025).
The comprehensive profile aim is to offer scholars, analysts, and policymakers an accessible reference that highlights the relative weight and strategic posture of each country within its region and globally.
The tables of comprehensive profile organize the data into ranked lists, revealing both the internal hierarchy of these countries and their standing in global rankings. Together, these metrics help to map the strategic landscape of one of the world’s most dynamic and contested macro-regions.
——————————————–
(A). Summary Table (Rankings by Population in 31 South Asian, Central Asian and Middle Eastern Countries) – Total Population (2024–2025 Estimates)
1. India – ~1.44 billion — World Rank: 1st
2. Pakistan – ~248 million — World Rank: 5th
3. Bangladesh – ~172 million — World Rank: 8th
4. Egypt – ~113 million — World Rank: 14th
5. Turkey – ~87 million — World Rank: 17th
6. Iran – ~85.96 million — World Rank: 18th
7. Sudan – ~48 million — World Rank: 30th
8. Afghanistan – ~42 million — World Rank: 36th
9. Iraq – ~40 million — World Rank: 38th
10. Saudi Arabia – ~37 million — World Rank: 40th
11. Uzbekistan – ~36 million — World Rank: 42nd
12. Yemen – ~34 million — World Rank: 44th (if included)
13. Nepal – ~31 million — World Rank: 49th
14. Sri Lanka – ~22 million — World Rank: 59th
15. Kazakhstan – ~20 million — World Rank: 60th
16. Syria – ~20 million — World Rank: 61st
17. United Arab Emirates (UAE) – ~10.2 million — World Rank: 95th
18. Jordan – ~10.2 million — World Rank: 96th
19. Israel – ~10.2 million — World Rank: 97th
20. Tajikistan – ~10.5 million — World Rank: 92nd
21. Azerbaijan – ~10.3 million — World Rank: 94th (if included)
22. Lebanon – ~6.83 million — World Rank: 109th
23. Turkmenistan – ~6.5 million — World Rank: 112th
24. Oman – ~5.49 million — World Rank: 120th
25. Palestine – ~5.2 million — World Rank: 122nd
26. Kuwait – ~4.26 million — World Rank: 131st
27. Qatar – ~2.9 million — World Rank: 138th
28. Bahrain – ~1.52 million — World Rank: 152nd
29. Cyprus – ~1.25 million — World Rank: 158th
30. Bhutan – ~800,000 — World Rank: 162nd
31. Maldives – ~560,000 — World Rank: 171st
Note: This table presents a comparative snapshot of population estimates (2024–2025) for 31 countries across South Asia, Central Asia, and the Middle East.
The countries are ranked by population size and include their corresponding approximate global position according to the latest demographic projections.
These rankings help contextualize the geopolitical and socio-economic weight of each state in the broader regional and global landscape.
All figures are rounded estimates based on publicly available data from international and national statistical sources as of mid-2025. Minor discrepancies may exist due to ongoing census updates, refugee movements, or internal displacement in conflict-affected states.
——————————————–
(B). Summary Table (Rankings by Economic Size in 31 South Asian, Central Asian and Middle Eastern Countries) – Total GDP, Nominal USD
1. India – ~US$ 3.57 trillion — World Rank: 5th
2. Turkey – ~US$ 1.12 trillion — World Rank: 17th
3. Saudi Arabia – ~US$ 1.07 trillion — World Rank: 18th
4. Israel – ~US$ 514 billion — World Rank: 33rd
5. UAE – ~US$ 514 billion — World Rank: 34th
6. Bangladesh – ~US$ 437 billion — World Rank: 37th
7. Iran – ~US$ 405 billion — World Rank: 39th
8. Egypt – ~US$ 396 billion — World Rank: 40th
9. Pakistan – ~US$ 338 billion — World Rank: 42nd
10. Kazakhstan – ~US$ 263 billion — World Rank: 46th
11. Iraq – ~US$ 251 billion — World Rank: 48th
12. Qatar – ~US$ 213 billion — World Rank: 52nd
13. Kuwait – ~US$ 164 billion — World Rank: 58th
14. Oman – ~US$ 109 billion — World Rank: 66th
15. Sudan – ~US$ 109 billion — World Rank: 67th
16. Uzbekistan – ~US$ 102 billion — World Rank: 68th
17. Sri Lanka – ~US$ 84 billion — World Rank: 73rd
18. Syria – ~US$ 77 billion — World Rank: 76th
19. Turkmenistan – ~US$ 65 billion — World Rank: 81st
20. Jordan – ~US$ 50 billion — World Rank: 88th
21. Nepal – ~US$ 45 billion — World Rank: 90th
22. Bahrain – ~US$ 44 billion — World Rank: 91st
23. Cyprus – ~US$ 30 billion — World Rank: 95th
24. Georgia – ~US$ 29 billion — World Rank: 97th
25. Yemen – ~US$ 28 billion — World Rank: 98th
26. Lebanon – ~US$ 22 billion — World Rank: 105th
27. Armenia – ~US$ 21 billion — World Rank: 106th
28. Palestine (West Bank & Gaza) – ~US$ 20 billion — World Rank: 108th (approximate)
29. Afghanistan – ~US$ 15 billion — World Rank: 116th
30. Maldives – ~US$ 6 billion — World Rank: 145th
31. Bhutan – ~US$ 3 billion — World Rank: 161st
Note: This table offers a comparative overview of the nominal Gross Domestic Product (GDP) of 31 countries in South Asia, Central Asia, and the Middle East, based on the most recent 2024–2025 estimates in U.S. dollars.
It ranks countries by the total size of their economies and includes their approximate global position in terms of nominal GDP. These figures serve as a key indicator of economic influence and development potential within each region.
The data reflects nominal GDP, not purchasing power parity (PPP), and may vary slightly depending on currency exchange fluctuations, energy market shifts, and international financial reporting standards.
All estimates are derived from authoritative international sources such as the IMF, World Bank, and national statistics offices, as of mid-2025.
——————————————–
(C). Summary Table (Rankings by Per Capita GDP in 31 South Asian, Central Asian, and Middle Eastern Countries and World Rank (2024–2025 Estimates)
1. Qatar – ~US$ 80,600 — World Rank: 6th
2. UAE – ~US$ 56,500 — World Rank: 9th
3. Israel – ~US$ 55,000 — World Rank: 11th
4. Kuwait – ~US$ 38,500 — World Rank: 21st
5. Saudi Arabia – ~US$ 30,500 — World Rank: 26th
6. Bahrain – ~US$ 29,000 — World Rank: 28th
7. Cyprus – ~US$ 24,000 — World Rank: 35th
8. Oman – ~US$ 21,800 — World Rank: 39th
9. Maldives – ~US$ 14,000 — World Rank: 53rd
10. Kazakhstan – ~US$ 13,500 — World Rank: 54th
11. Turkey – ~US$ 11,800 — World Rank: 60th
12. Turkmenistan – ~US$ 10,200 — World Rank: 66th
13. Iraq – ~US$ 5,900 — World Rank: 79th
14. Jordan – ~US$ 4,700 — World Rank: 81st
15. Iran – ~US$ 4,400 — World Rank: 84th
16. Sri Lanka – ~US$ 4,000 — World Rank: 88th
17. Egypt – ~US$ 4,000 — World Rank: 89th
18. Lebanon – ~US$ 3,900 — World Rank: 90th
19. Bhutan – ~US$ 3,800 — World Rank: 91st
20. India – ~US$ 2,700 — World Rank: 98th
21. Uzbekistan – ~US$ 2,600 — World Rank: 101st
22. Bangladesh – ~US$ 2,400 — World Rank: 104th
23. Kyrgyzstan – ~US$ 2,100 — World Rank: 109th
24. Palestine (West Bank & Gaza) – 25. Nepal – ~US$ 1,550 — World Rank: 117th 26. Pakistan – ~US$ 1,550 — World Rank: 118th 27. Tajikistan – ~US$ 1,150 — World Rank: 125th 28. Sudan – ~US$ 700 — World Rank: 137th 29. Syria – ~US$ 600 — World Rank: 139th 30. Yemen – ~US$ 560 — World Rank: 142nd 31. Afghanistan – ~US$ 330 — World Rank: 147th Note: This table ranks 31 countries in South Asia, Central Asia, and the Middle East by nominal GDP per capita in U.S. dollars, based on the most current 2024–2025 estimates. It highlights economic disparities across the region, from ultra-high-income states like Qatar and the UAE to conflict-affected or aid-dependent economies such as Afghanistan, Yemen, and Palestine. The figures reflect nominal per capita income and do not adjust for purchasing power parity (PPP). Rankings may fluctuate due to currency shifts, energy prices, demographic changes, and official data revisions. Data is compiled from authoritative international institutions including the IMF, World Bank, and national statistics bureaus as of mid-2025. ——————————————– (D). Summary Table (Rankings by Military Power in 31 South Asian, Central Asian and Middle Eastern Countries): According to the Global Firepower Index 2024 1. India – World Rank: 4th 2. Pakistan – World Rank: 7th 3. Turkey – World Rank: 8th 4. Iran – World Rank: 14th 5. Egypt – World Rank: 15th 6. Israel – World Rank: 17th 7. Saudi Arabia – World Rank: 22nd 8. UAE – World Rank: 54th 9. Iraq – World Rank: 45th 10. Bangladesh – World Rank: 42nd 11. Syria – World Rank: 64th 12. Uzbekistan – World Rank: 62nd 13. Kazakhstan – World Rank: 64th 14. Yemen – World Rank: 74th 15. Oman – World Rank: 76th 16. Qatar – World Rank: 77th 17. Kuwait – World Rank: 78th 18. Turkmenistan – World Rank: 82nd 19. Jordan – World Rank: 89th 20. Sri Lanka – World Rank: 71st 21. Nepal – World Rank: 94th 22. Tajikistan – World Rank: 99th 23. Kyrgyzstan – World Rank: 107th 24. Cyprus – World Rank: 110th 25. Lebanon – World Rank: 118th 26. Bahrain – World Rank: 119th 27. Sudan – World Rank: 73rd 28. Bhutan – World Rank: 141st 29. Maldives – World Rank: 151st 30. Afghanistan – Not officially ranked (Under Taliban rule; no internationally recognized national army) 31. Palestine – Not ranked (No formal armed forces recognized) Note: This table presents the 2024 Global Firepower Index (GFP) rankings for 31 countries across South Asia, Central Asia, and the Middle East, offering a comparative assessment of conventional military strength. The GFP ranking considers over 60 individual factors, including active personnel, defence budget, airpower, land and naval assets, logistical capacity, geography, and technological advancement. It is important to note that while countries like India, Pakistan, and Turkey rank within the global top 10 due to their large forces and strategic capabilities, others—such as Afghanistan and Palestine—remain unranked due to the absence of internationally recognized or unified military forces. These rankings reflect relative military capabilities and strategic positioning rather than political intentions or alliance commitments (e.g., NATO, CSTO, or regional coalitions). All data has been sourced from the Global Firepower Index 2024, a widely used military strength comparison platform updated annually. ——————————————– (E). The list of all 31 countries of the South Asian, Central Asian, and Middle Eastern regions. Each country profile includes: Area Year of Founding or Independence Population (2024–25 estimates) Religious Demography Language Demography Economy Global Economic Position (GDP & Per Capita GDP) Military Power (relative to region and globally, if available) Comprehensive Profiles of 31 Countries (by Alphabetical Order) 1. Afghanistan Area: 652,864 km² Year of Founding: 1919 (Independence from British influence) Population: ~42 million Religious Demography: ~99% Muslim (85% Sunni, 15% Shia) Language Demography: Pashto, Dari (Persian), Turkic dialects Economy: Agriculture, informal trade, opium, aid Global Economic Position: GDP ~$15 billion; Per capita ~$400 Military Power: Taliban-led forces; not ranked in formal indices 2. Bahrain Area: 760 km² Year of Independence: 1971 (from Britain) Population: ~1.52 million Religious Demography: Shia ~65%, Sunni ~35% Language Demography: Arabic (Bahraini), English widely used Economy: Oil refining, banking, finance Global Economic Position: GDP ~$44 billion; Per capita ~$26,000 Military Power: Small but modern; ranked ~122nd globally (GFP) 3. Bangladesh Area: 147,570 km² Year of Founding: 1971 (from Pakistan) Population: ~172 million Religious Demography: ~90% Muslim, ~8.5% Hindu Language Demography: Bengali (official), English Economy: Textiles, remittances, agriculture Global Economic Position: GDP ~$460 billion; Per capita ~$2,700 Military Power: 3rd in South Asia; ranked ~42nd globally 4. Bhutan Area: 38,394 km² Year of Founding: Unified 17th century; constitutional monarchy since 2008 Population: ~800,000 Religious Demography: Vajrayana Buddhism ~75%, Hindu ~23% Language Demography: Dzongkha, Tshangla, Nepali Economy: Hydropower, tourism, agriculture Global Economic Position: GDP ~$3 billion; Per capita ~$3,800 Military Power: Minimal; defence support from India 5. Cyprus Area: 9,251 km² Year of Independence: 1960 (from British rule) Population: ~1.25 million Religious Demography: Greek Orthodox ~90%, Muslim ~5% Language Demography: Greek, Turkish; English widespread Economy: Tourism, finance, energy Global Economic Position: GDP ~$30 billion; Per capita ~$24,000 Military Power: Limited; internal defence structure 6. Egypt Area: 1,001,450 km² Year of Independence: 1922 (from Britain) Population: ~113 million Religious Demography: ~90% Muslim, ~10% Christian (Coptic) Language Demography: Arabic (Egyptian), English Economy: Suez Canal, agriculture, tourism, gas Global Economic Position: GDP ~$450 billion; Per capita ~$4,000 Military Power: 3rd in Middle East; 15th globally 7. India Area: 3,287,263 km² Year of Independence: 1947 (from Britain) Population: ~1.44 billion Religious Demography: Hindu ~79%, Muslim ~14%, others Language Demography: Hindi, English, 21 scheduled languages Economy: Services, IT, manufacturing, agriculture Global Economic Position: GDP ~$3.9 trillion; Per capita ~$2,800 Military Power: 1st in South Asia; 4th globally 8. Iran Area: 1,648,195 km² Year of Establishment: 1979 (Islamic Republic) Population: ~85.96 million Religious Demography: Shia ~90–95%; Sunni minorities Language Demography: Persian (Farsi), Azeri, Kurdish, Arabic Economy: Oil, gas, manufacturing Global Economic Position: GDP ~$341 billion; Per capita ~$3,900 Military Power: 2nd in Middle East; 14th globally 9. Iraq Area: 438,317 km² Year of Independence: 1932 (from Britain) Population: ~44 million Religious Demography: Shia ~60%, Sunni ~30%, others Language Demography: Arabic, Kurdish Economy: Oil-driven; reconstruction economy Global Economic Position: GDP ~$270 billion; Per capita ~$6,000 Military Power: Regional force; rebuilding capacity 10. Israel Area: 22,145 km² Year of Founding: 1948 Population: ~10 million Religious Demography: ~74% Jewish, ~21% Muslim, Christians & Druze Language Demography: Hebrew, Arabic, Russian, English Economy: High-tech, defence, agriculture Global Economic Position: GDP ~$525 billion; Per capita ~$51,000 Military Power: Advanced; ~18th globally 11. Jordan Area: 89,342 km² Year of Independence: 1946 (from Britain) Population: ~11.5 million Religious Demography: ~97% Sunni Muslim, ~3% Christian Language Demography: Arabic, English Economy: Tourism, phosphate, remittances Global Economic Position: GDP ~$55 billion; Per capita ~$5,200 Military Power: Moderate; U.S.-allied capabilities 12. Kazakhstan Area: 2,724,900 km² Year of Independence: 1991 (from USSR) Population: ~19.9 million Religious Demography: Muslim ~70%, Orthodox ~26% Language Demography: Kazakh, Russian Economy: Oil, mining, wheat Global Economic Position: GDP ~$245 billion; Per capita ~$12,300 Military Power: Largest in Central Asia 13. Kuwait Area: 17,818 km² Year of Independence: 1961 (from Britain) Population: ~4.6 million Religious Demography: Sunni ~70%, Shia ~30% Language Demography: Arabic, English Economy: Oil-based; sovereign wealth fund Global Economic Position: GDP ~$165 billion; Per capita ~$33,000 Military Power: Small but well-equipped 14. Kyrgyzstan Area: 199,951 km² Year of Independence: 1991 (from USSR) Population: ~7 million Religious Demography: ~90% Muslim, ~7% Christian Language Demography: Kyrgyz, Russian Economy: Agriculture, mining, remittances Global Economic Position: GDP ~$11 billion; Per capita ~$1,500 Military Power: Limited; relies on Russian partnership 15. Lebanon Area: 10,452 km² Year of Independence: 1943 (from France) Population: ~6.5 million Religious Demography: Sunni, Shia, Maronite, Druze Language Demography: Arabic, French, English Economy: Services, banking, diaspora Global Economic Position: GDP ~$24 billion; Per capita ~$3,700 Military Power: Moderate; internal focus Continuing with the remaining 16 countries (16–31) in the same format: 16. Maldives Area: 298 km² (island nation) Year of Independence: 1965 (from Britain) Population: ~520,000 Religious Demography: 100% Sunni Muslim (state religion) Language Demography: Dhivehi (official), English Economy: Tourism, fishing, foreign aid Global Economic Position: GDP ~$6 billion; Per capita ~$10,500 Military Power: Minimal; Coast Guard and police-style force 17. Nepal Area: 147,516 km² Year of Unification: 1768; Republic since 2008 Population: ~30.7 million Religious Demography: Hindu ~81%, Buddhist ~9%, Muslim ~4% Language Demography: Nepali (official), Maithili, Bhojpuri, Tamang Economy: Remittances, agriculture, tourism Global Economic Position: GDP ~$45 billion; Per capita ~$1,400 Military Power: Small; supports UN peacekeeping 18. Oman Area: 309,500 km² Year of Independence: 1650 (from Portugal); modern state 1970 Population: ~4.7 million Religious Demography: Ibadhi Muslim ~45%, Sunni, Shia minorities Language Demography: Arabic, English, Balochi, Swahili Economy: Oil, gas, fishing, tourism Global Economic Position: GDP ~$115 billion; Per capita ~$24,000 Military Power: Small but professional 19. Pakistan Area: 881,913 km² Year of Founding: 1947 (from British India) Population: ~250 million Religious Demography: ~96% Muslim (Sunni ~85%, Shia ~15%) Language Demography: Urdu (official), Punjabi, Pashto, Sindhi, others Economy: Agriculture, textiles, services, remittances Global Economic Position: GDP ~$375 billion; Per capita ~$1,500 Military Power: 2nd in South Asia; 7th globally 20. Palestine (West Bank & Gaza) Area: ~6,220 km² Declared Independence: 1988 (limited recognition) Population: ~5.4 million Religious Demography: ~98% Muslim, ~1–2% Christian Language Demography: Arabic Economy: Aid-based, agriculture, services Global Economic Position: GDP ~$20 billion; Per capita ~$3,700 Military Power: None; paramilitary under Palestinian Authority and Hamas 21. Qatar Area: 11,581 km² Year of Independence: 1971 (from Britain) Population: ~2.8 million Religious Demography: ~67% Muslim, Hindu, Christian, and Buddhist minorities Language Demography: Arabic (official), English, Hindi, Urdu Economy: LNG, oil, finance Global Economic Position: GDP ~$235 billion; Per capita ~$80,000 Military Power: Small but advanced 22. Saudi Arabia Area: 2,149,690 km² Year of Founding: 1932 Population: ~37 million Religious Demography: 100% Muslim (Sunni Wahhabi dominant) Language Demography: Arabic (official), English, Urdu, Tagalog Economy: Oil-based; Vision 2030 diversification Global Economic Position: GDP ~$1.1 trillion; Per capita ~$27,000 Military Power: 1st in Arab World; ~23rd globally 23. Sri Lanka Area: 65,610 km² Year of Independence: 1948 (from Britain) Population: ~22 million Religious Demography: Buddhist ~70%, Hindu ~12.6%, Muslim ~9.7%, Christian ~7.4% Language Demography: Sinhala, Tamil, English Economy: Tourism, textiles, agriculture Global Economic Position: GDP ~$87 billion; Per capita ~$3,900 Military Power: Medium-sized; post-conflict stabilization 24. State of Palestine (De facto Gaza Strip separate) Area: (included earlier with West Bank & Gaza) See Entry 20 for a full profile 25. Syria Area: 185,180 km² Year of Independence: 1946 (from France) Population: ~23 million (including displaced) Religious Demography: Sunni ~74%, Alawite, Christian, Druze Language Demography: Arabic, Kurdish, Armenian, Aramaic Economy: War-ravaged; aid-dependent Global Economic Position: GDP ~$22 billion; Per capita ~$900 Military Power: Weakened due to civil war; supported by Russia 26. Tajikistan Area: 143,100 km² Year of Independence: 1991 (from USSR) Population: ~10.5 million Religious Demography: Muslim ~98%, Christian minorities Language Demography: Tajik (Persian), Russian Economy: Remittances, aluminium, agriculture Global Economic Position: GDP ~$10 billion; Per capita ~$950 Military Power: Small; Russian base present 27. Turkey Area: 783,356 km² Year of Founding: 1923 (Republic declared) Population: ~85 million Religious Demography: ~99% Muslim (Sunni majority) Language Demography: Turkish, Kurdish, Arabic Economy: Industry, tourism, agriculture Global Economic Position: GDP ~$1.1 trillion; Per capita ~$12,700 Military Power: NATO’s 2nd largest; ~11th globally 28. Turkmenistan Area: 488,100 km² Year of Independence: 1991 (from USSR) Population: ~6.5 million Religious Demography: Muslim ~90%, Russian Orthodox ~9% Language Demography: Turkmen, Russian Economy: Gas exports, agriculture Global Economic Position: GDP ~$50 billion; Per capita ~$7,600 Military Power: Limited; neutral policy 29. United Arab Emirates (UAE) Area: 83,600 km² Year of Independence: 1971 (from Britain) Population: ~10 million (89% ex-pats) Religious Demography: ~76% Muslim, others Hindu, Christian Language Demography: Arabic (official), English, Hindi, Urdu Economy: Oil, tourism, finance Global Economic Position: GDP ~$550 billion; Per capita ~$54,000 Military Power: Advanced, intervention-capable; ~50th globally 30. Uzbekistan Area: 448,978 km² Year of Independence: 1991 (from USSR) Population: ~36 million Religious Demography: Muslim ~90%, Russian Orthodox ~9% Language Demography: Uzbek, Russian Economy: Natural gas, gold, cotton Global Economic Position: GDP ~$90 billion; Per capita ~$2,500 Military Power: Strongest in Central Asia 31. Yemen Area: 555,000 km² Year of Unification: 1990 (North & South Yemen) Population: ~35 million Religious Demography: Sunni ~65%, Zaidi Shia ~35% Language Demography: Arabic Economy: Fragile; conflict-ridden, aid-dependent Global Economic Position: GDP ~$20 billion; Per capita ~$500 Military Power: Fragmented due to civil war Note: Comprehensive Profiles of 31 Countries, offers a comparative overview of the South Asian, Central Asian, and Middle Eastern states, arranged alphabetically. Each profile includes key indicators—geographic area, historical independence or founding, population, religious and linguistic demography, economic sectors, GDP data, and military capacity. The purpose is to provide a fact-based, accessible reference for analysts, students, and researchers examining regional dynamics across interconnected geopolitical zones. While the figures presented are current as of mid-2025, they are rounded estimates intended for general understanding rather than exhaustive statistical analysis. ——————————————– Conclusion This comparative overview of 31 South Asian, Central Asian, and Middle Eastern countries underscores the profound regional disparities and strategic contrasts across population size, economic performance, and military capability. While countries like India, Pakistan, Turkey, Saudi Arabia, and Iran emerge as major regional powers with significant global influence, others such as Bhutan, Maldives, and Palestine remain limited in conventional metrics yet possess distinct geopolitical relevance shaped by geography, alliances, or ideological symbolism. The data presented in this profile is not merely descriptive; it offers a basis for further analysis of shifting power dynamics, economic vulnerabilities, and potential security flashpoints. As global multipolarity intensifies and regional rivalries evolve—particularly in light of energy transitions, great power competition, and civilizational reassertions—these 31 countries will continue to shape the future trajectory of Eurasia and the broader Global South. This profile provides a foundational lens through which to assess their present capacities and future roles on the world stage. ——————————————– Author Biography Dr. Masood Tariq is a Karachi-based politician and political theorist. He formerly served as Senior Vice President of the Pakistan Muslim Students Federation (PMSF) Sindh, Councillor of the Municipal Corporation Hyderabad, Advisor to the Chief Minister of Sindh, and Member of the Sindh Cabinet. His research explores South Asian geopolitics, postcolonial state formation, regional nationalism, and inter-ethnic politics, with a focus on the Punjabi question and Cold War strategic alignments. He also writes on Pakistan’s socio-political and economic structures, analysing their structural causes and proposing policy-oriented solutions aligned with historical research and contemporary strategy. His work aims to bridge historical scholarship and strategic analysis to inform policymaking across South Asia, Central Asia, and the Middle East.


Leave a Reply